Sonar Experiment No. 2
This experiment is a follow-on to Sonar Experiment No. 1. In the previous experiment, I took a look at the beam pattern for a few ultrasonic sensors. This time around, I moved the experiment outdoors, and looked at how the sensors behave while in motion.
Materials
Here's what I used to conduct this experiment
[ ] Brake 'Bot - equipped with two front-facing ultrasonic sensors and one rear-facing ultrasonic sensor
[ ] small whiteboard (24" x 18") - used as my target reflector
[ ] empty parking lot - no cars, no trees, no lamp post; just flat, open space
[ ] Arduino sketch to log ultrasonic measurements to an SD card (pushPingLogger.ino)
| pushPingLogger.ino |
Procedure
I divided this experiment into three phases:
Phase 1: Brake 'Bot was placed in an open area and collected data from one front-facing sensor and the rear-facing sensor. No driving took place and no obstacles were present.
Phase 2: Brake 'Bot was manually driven for three pacing tours. Each tour was driven in a fairly straight path from one end of the test area to the other. I did my best to maintain the vehicle speed around 15 mph (about half its maximum speed). I slowed Brake 'Bot down to execute a controlled turn at the end of each tour.
Phase 3: Brake 'Bot was manually driven for three approaches to a target reflector (a whiteboard propped up by my toolbox). After each approach, I slowed Brake 'Bot down to execute a controlled turn about 30 cm in front of the target. Then, I drove back to the start.
All driving was performed using the stock transmitter and receiver. For each phase, I performed a run with the Front/Left sensor and then another run with the Front/Right sensor.
Observations
I used a spreadsheet program to import and plot the data. For each plot, the x-axis shows the sequence number associated with each ultrasonic measurement. The y-axis shows the range I calculated given the measured round-trip-time of the ping signal. Although I collected good data, the results weren't quite what I expected. But I think I know why the data came out the way they did.
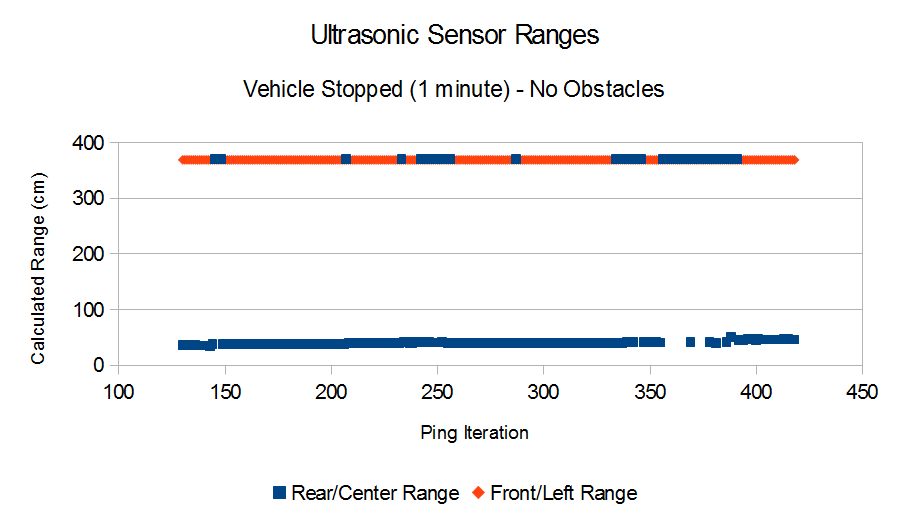
Figure 1 - The most noticeable feature is that the front and rear sensor ranges aren't on top of each other. I expected that both sensors would report their maximum values since the vehicle was not in motion and no obstacles were present.
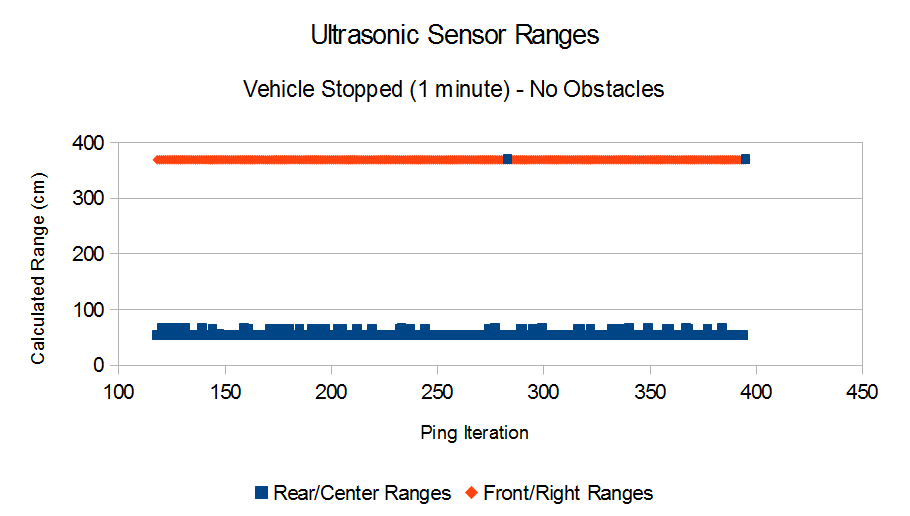
Figure 2 - Although the values are mostly consistent, they don't align. The front sensor reported its maximum range value and the rear sensor reported an object about 55 cm away.
Brake 'Bot's rear end was pointing to the ground! A large portion of the chassis' weight in the back is due to the motor. Unfortunately, I made things worse by mounting the battery towards the back end of the electronics housing much like I had done with Bebop (see Note 1). As a result, the rear sensor was pointing downwards and the front sensor was pointing upwards.
Figure 1 shows some inconsistent behavior from the rear sensor. During that run, Brake 'Bot's drive motor was jittery. I was able to apply some trim to reduce the short bursts from the motor, but some of the bursts were too great. I think this may have happened because I mounted the receiver antenna to lay flat under the electronics housing instead of pointing upwards.
Figure 2's results look promising. The data values are quite consistent while the vehicle was at rest.
-----
Note 1: This battery only powered the electronics. The drive motor / steering servo battery was in its usual location - along the centerline of the chassis.
The data below was collected while I paced Brake 'Bot back and forth within the test area. As before, no obstacles were present.
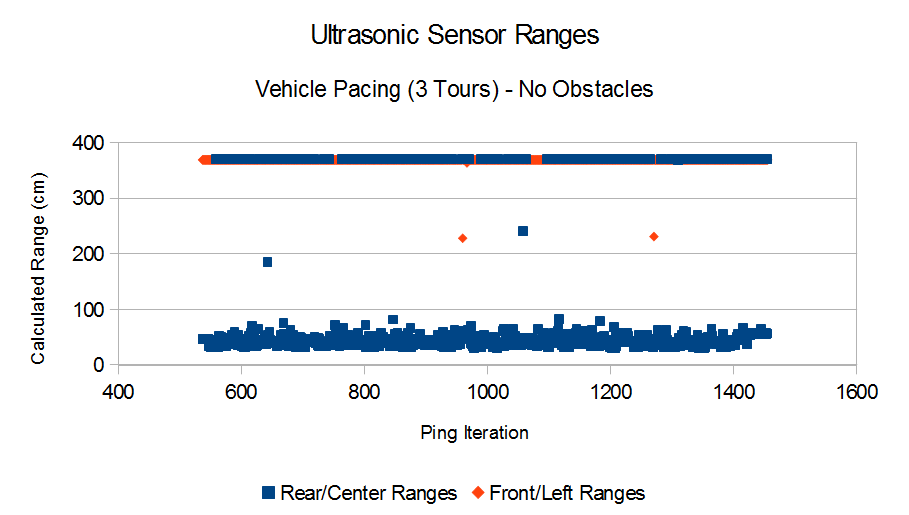
Figure 3 - The Front Sensor range values are hidden behind the Rear Sensor values. The Rear Sensor alternated between reporting its maximum value and reporting the range to the ground behind the vehicle.
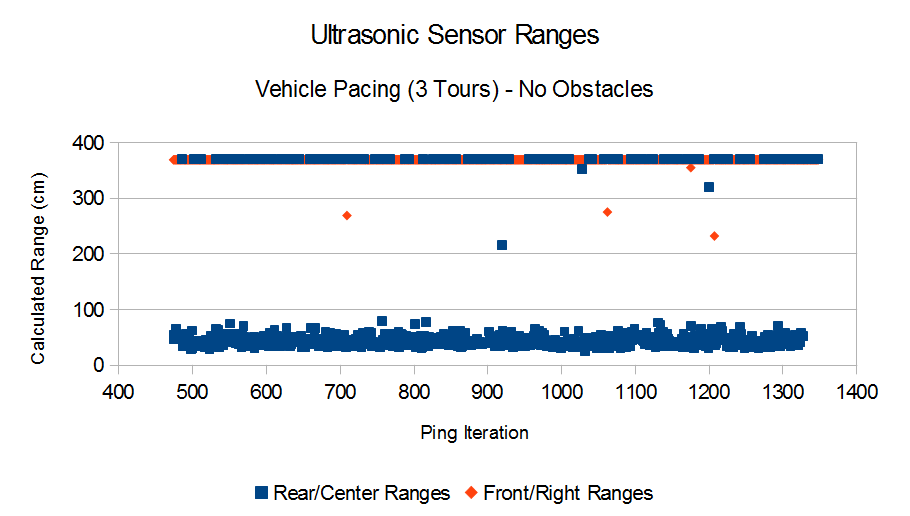
Figure 4 - The turns are more prominent on this run.
In Figure 3, there are two Front Sensor values that show just about when I turned Brake 'Bot around to pace in the other direction (approximately at x = 950 and x = 1290). I may have taken the first turn fairly slow.
Both figures show variability in the Rear Sensor's readings. Ignoring for a moment that the vehicle was back-heavy at the time, something similar might occur if the Front Sensor was more level. The norm for Brake 'Bot's sensors (while in motion on pavement) might appear as cloudy as the Rear Sensor's reading, only centered around a greater range value. The only way to know for sure is to collect more data!
Both figures show variability in the Rear Sensor's readings. Ignoring for a moment that the vehicle was back-heavy at the time, something similar might occur if the Front Sensor was more level. The norm for Brake 'Bot's sensors (while in motion on pavement) might appear as cloudy as the Rear Sensor's reading, only centered around a greater range value. The only way to know for sure is to collect more data!
For the final phase, I drove Brake 'Bot towards one obstacle - a small whiteboard.
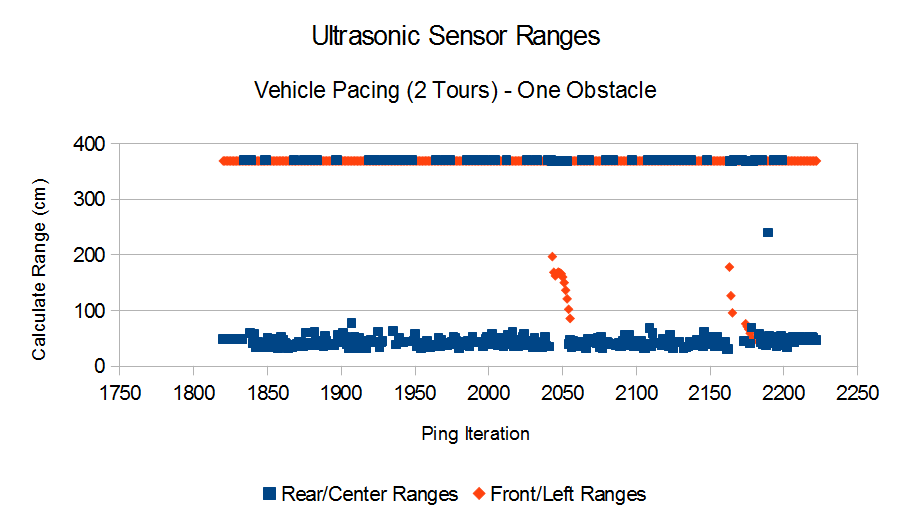
Figure 5 - I only performed two tours during this run. I might have fallen asleep at the wheel at the time.
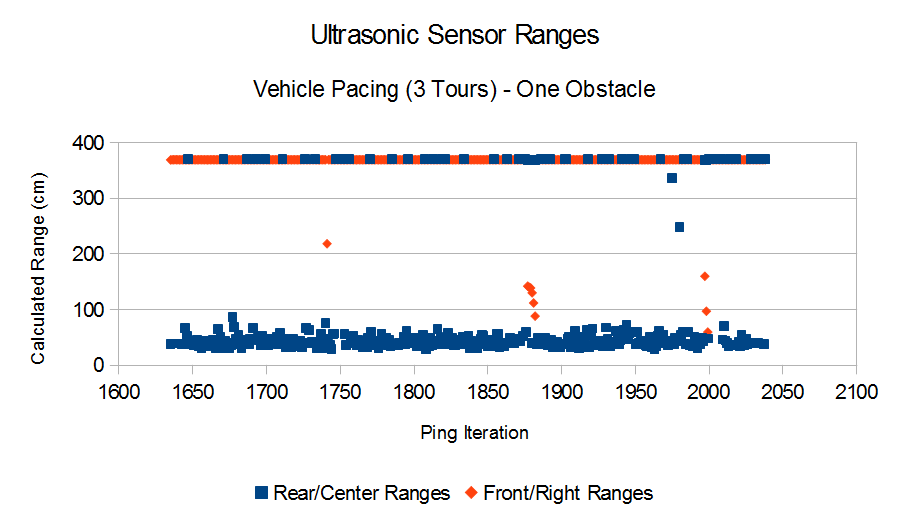
Figure 6 - The first approach to the target isn't as dramatic as the following two approaches.
It's interesting to see how the sensors detected the oncoming obstacle! My first thought after seeing this was that an automated braking maneuver might require a similar shape. But I have a few more things to accomplish before programming that. In the mean time, I think it's good enough to set the stage for future data collections.
Future Work
I plan on repeating this experiment with a better vehicle-weight distribution. This may require miniaturizing my current Arduino/breadboard arrangement. It's about time I used shields to "build upward." This should give me flexibility to move the battery to a better location within the electronics housing. I'll also consider adding risers to the chassis suspension so that the vehicle doesn't shift its weight as much while maneuvering.
There's a better way to extract the data and plot them. Using a spreadsheet program is good for taking an initial look at the data, say after each experiment phase while out in the field. But it's not very convenient when I want to make a series of plots. Since I know exactly what kinds of plots I want, I really should automate this process. I'll look into writing a Python script to help automate my data analysis. This should make my life easier for future data collections.
The data might be enhanced with another plot showing the vehicle's heading during each run. By doing this, the vehicle's orientation will be more evident. I'll integrate a compass into the electronics and record the heading values alongside the ultrasonic sensor measurements.
Repeat this experiment on a grassy field just to see what the data will look like.
Raw Data
If you'd like to take a look at or play around with the data, help yourself to the raw data I collected. The file naming scheme goes something like this: LGVL stands for Left sensor on a Gravel surface.
The odd-numbered data files were collected while I was repositioning the vehicle to setup for the next experiment phase. The values in those files can be ignored. Be sure to look at the Arduino sketch to see exactly what I did. If you have any questions or suggestions for improvement, give me a shout!
The odd-numbered data files were collected while I was repositioning the vehicle to setup for the next experiment phase. The values in those files can be ignored. Be sure to look at the Arduino sketch to see exactly what I did. If you have any questions or suggestions for improvement, give me a shout!
| raw-sensor-data.zip |
Last Update: 17 December 2013